TAcharts
Apply popular TA tools and charts to candlestick data with NumPy.
System Structure
저장소별 전략/실행 조건 확인 필요
백테스트/분석 결과를 바탕으로 수동 판단
Editor Summary저장소 설명과 공개 메타데이터 기준으로 Python 기반 구현, 암호화폐 거래 봇, 거래소 API/프레임워크, 백테스트 성격의 프로젝트로 파악했습니다. 확인 근거는 README, 저장소 토픽, 저장소 설명, GitHub 지표, 파이프라인 필드이며, 주요 데이터는 암호화폐 거래소 시장 데이터, OHLCV/호가/체결 데이터입니다. 전략/실행 조건은 저장소별 문서와 코드 확인이 필요하며, 실행 방식은 "백테스트/분석 결과를 바탕으로 수동 판단"라고 보수적으로 기록했습니다. GitHub 지표는 별 154개, 포크 34개입니다.
| Repository | pegahcarter/TAcharts |
|---|---|
| Creator | pegahcarter |
| Stars / Forks | ★ 154 / 34 |
| License | GPL-3.0 |
| Last Updated | 2023-01-01 |
| Snapshot Date | 2026-07-08 (README below is a copy from this date) |
This is third-party open-source code. QuantField does not guarantee its behavior or safety. Review the code before installing or running it.
README
TAcharts 0.0.30
By: Carter Carlson
Contributors: @juanfrcaliz, @rnarciso, @t3ch9
This repository provides technical tools to analyze OHLCV data, along with several TA chart functionalities. These functions are optimized for speed and utilize numpy vectorization over built-in pandas methods when possible.
Methods
Indicators With Chart Functionality
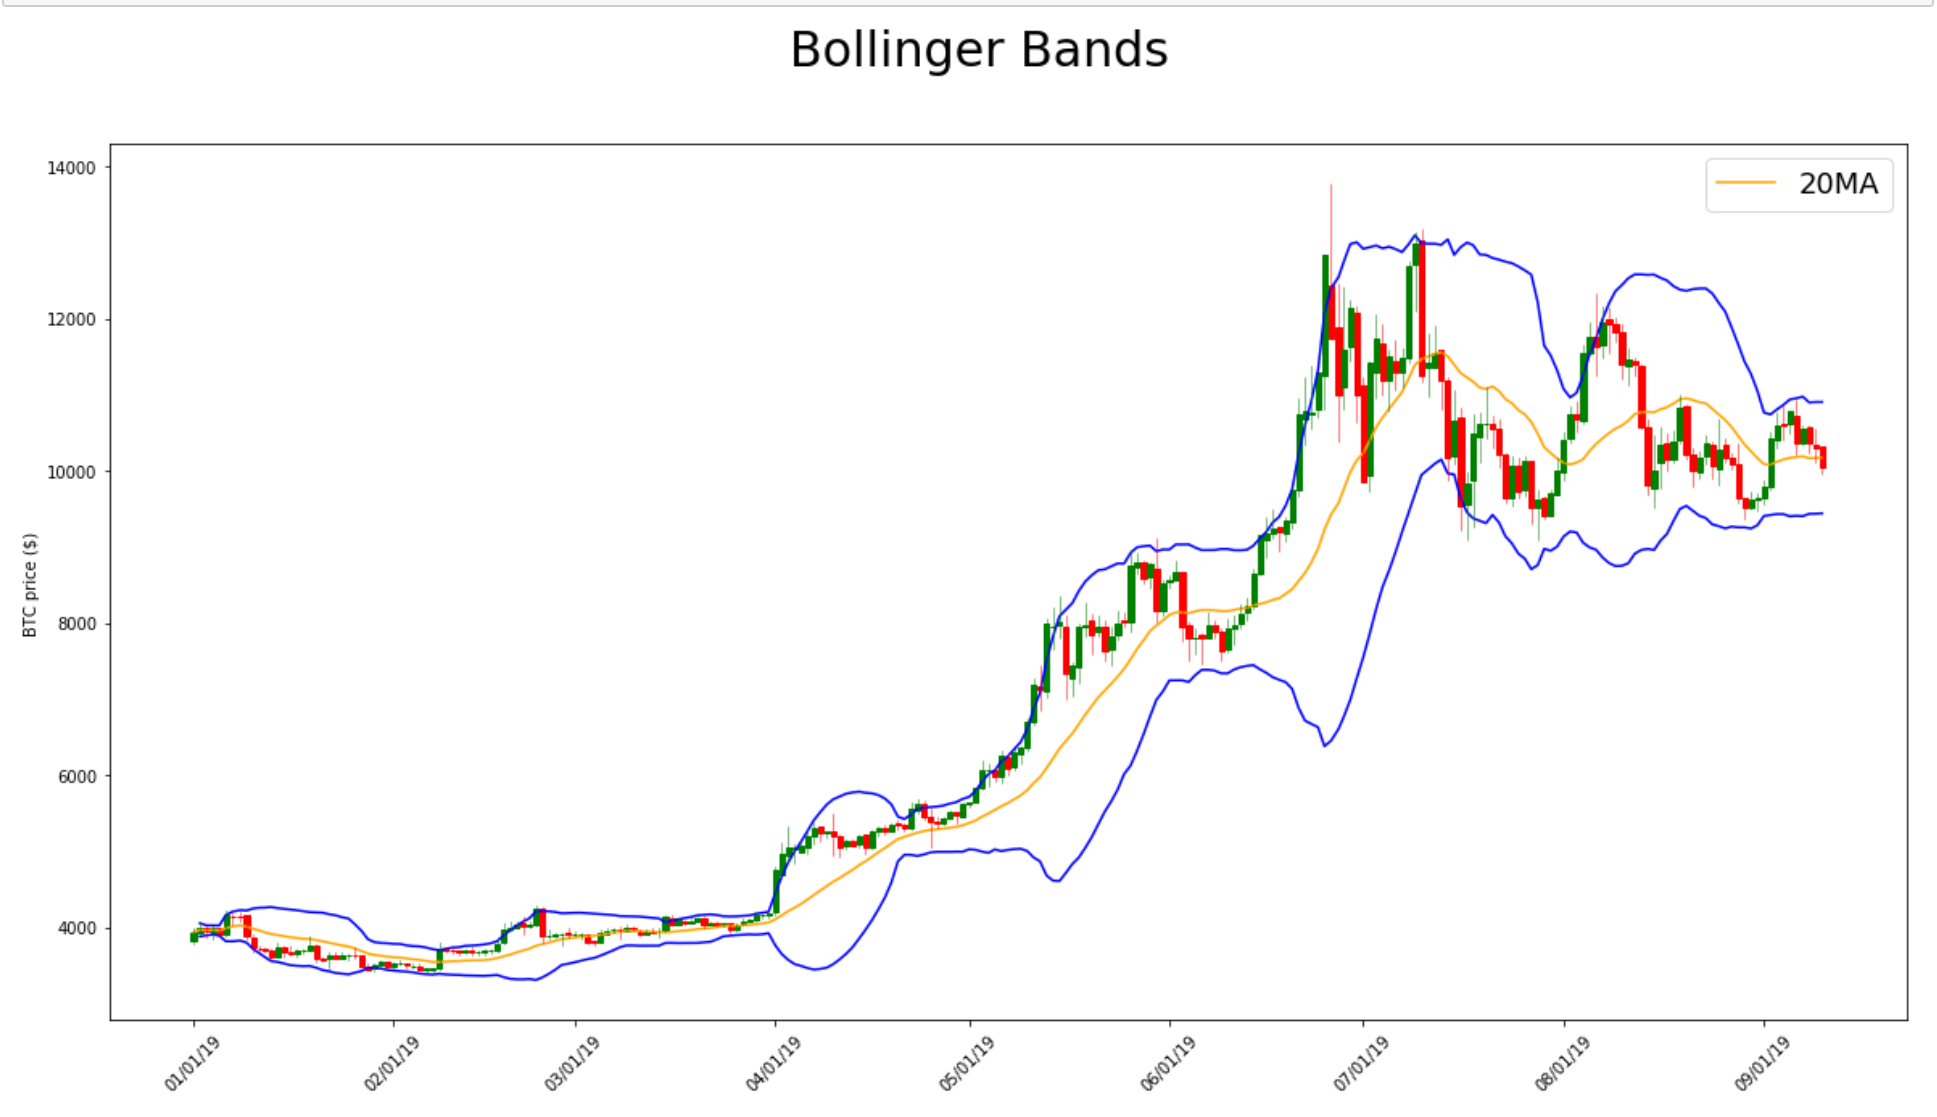
Bollinger(df=None, filename=None, interval=None, n=20, ndev=2): Bollinger BandsIchimoku(df=None, filename=None, interval=None): Ichimoku CloudRenko(df=None, filename=None, interval=None): Renko Chart
Indicators Without Chart Functionality
atr(high, low, close, n=2): average true range from candlestick datacmf(df, n=2): Chaikin Money Flow of an OHLCV datasetdouble_smooth(src, n_slow, n_fast): The smoothed value of two EMAsema(src, n=2): exponential moving average for a list ofsrcacrossnperiodsmacd(src, slow=25, fast=13): moving average convergence/divergence ofsrcmmo(src, n=2): Murrey Math oscillator ofsrcroc(src, n=2): rate of change ofsrcacrossnperiodsrolling(src, n=2, fn=None, axis=1): rollingsum,max,min,mean, ormedianofsrcacrossnperiodsrsi(src, n=2): relative strength index ofsrcacrossnperiodssdev(src, n=2): standard deviation across n periodssma(src, n=2): simple moving average ofsrcacrossnperiodstd_sequential(src, n=2): TD sequential ofsrcacrossnperiodstsi(src, slow=25, fast=13): true strength indicator
utils
area_between(line1, line2): find the area between line1 and line2crossover(x1, x2): find all instances of intersections between two linesdraw_candlesticks(ax, df): add candlestick visuals to a matplotlib chartfill_values(averages, interval, target_len): Fill missing values with evenly spaced samples.- Example: You're using 15-min candlestick data to find the 1-hour moving average and want a value at every 15-min mark, and not every 1-hour mark.
group_candles(df, interval=4): combine candles so instead of needing a different dataset for each time interval, you can form time intervals using more precise data.- Example: you have 15-min candlestick data but want to test a strategy based
on 1-hour candlestick data (
interval=4).
- Example: you have 15-min candlestick data but want to test a strategy based
on 1-hour candlestick data (
intersection(a0, a1, b0, b1): find the intersection coordinates between vector A and vector B
How it works
Create your DataFrame
# NOTE: we are using 1-hour BTC OHLCV data from 2019.01.01 00:00:00 to 2019.12.31 23:00:00
from TAcharts.utils.ohlcv import OHLCV

df = OHLCV().btc

df.head()
| date | open | high | low | close | volume | |
|---|---|---|---|---|---|---|
| 0 | 2019-01-01 00:00:00 | 3699.95 | 3713.93 | 3697.00 | 3703.56 | 660.279771 |
| 1 | 2019-01-01 01:00:00 | 3703.63 | 3726.64 | 3703.34 | 3713.83 | 823.625491 |
| 2 | 2019-01-01 02:00:00 | 3714.19 | 3731.19 | 3707.00 | 3716.70 | 887.101362 |
| 3 | 2019-01-01 03:00:00 | 3716.98 | 3732.00 | 3696.14 | 3699.95 | 955.879034 |
| 4 | 2019-01-01 04:00:00 | 3699.96 | 3717.11 | 3698.00 | 3713.07 | 534.113945 |
Bollinger Bands
from TAcharts.indicators.bollinger import Bollinger

b = Bollinger(df)
b.build(n=20, ndev=2)

b.plot()